

OFFICIAL YOUTUBE CREATOR PROFILE
Dr. Todd Grande
@drgrande · 1.7M YouTube subscribers
Sign in to Follow
0 following on Crimefien
Visit on YouTube ↗
Dr. Grande's YouTube Channel covers topics related to counselor education and supervision including but not limited to mental health, human behavior, relationship dynamics, psychopathology, personality theory, true crime, pop culture, research, statistics, SPSS, Excel, appraisal, and group counseling. Dr. Grande has a Ph.D. in Counselor Education and Supervision. He is a Licensed Professional Counselor of Mental Health (LPCMH) and a Licensed Chemical Dependency Professional (LCDP). Disclaimer: The channel is for informational purposes only. Nothing on this channel is intended to substitute for the treatment provided by a mental health prof…
FRESH FROM THE CREATORS
Statistics and Probabilities in Excel
 ▶
Calculating the Number of Unique Numbers and Unique Values in a Range using ExcelDr. Todd Grande · Jan 6, 2017
 ▶
Kendall's Coefficient of Concordance (Kendall's W) in ExcelDr. Todd Grande · Jan 4, 2017
 ▶
Sign Test as a Non-Parametric Alternative to a One-Sample T Test in ExcelDr. Todd Grande · Dec 31, 2016
 ▶
McNemar Test in ExcelDr. Todd Grande · Dec 29, 2016
 ▶
Wilcoxon Signed-Rank Test in ExcelDr. Todd Grande · Dec 26, 2016
 ▶
Mann-Whitney U Test in ExcelDr. Todd Grande · Dec 23, 2016
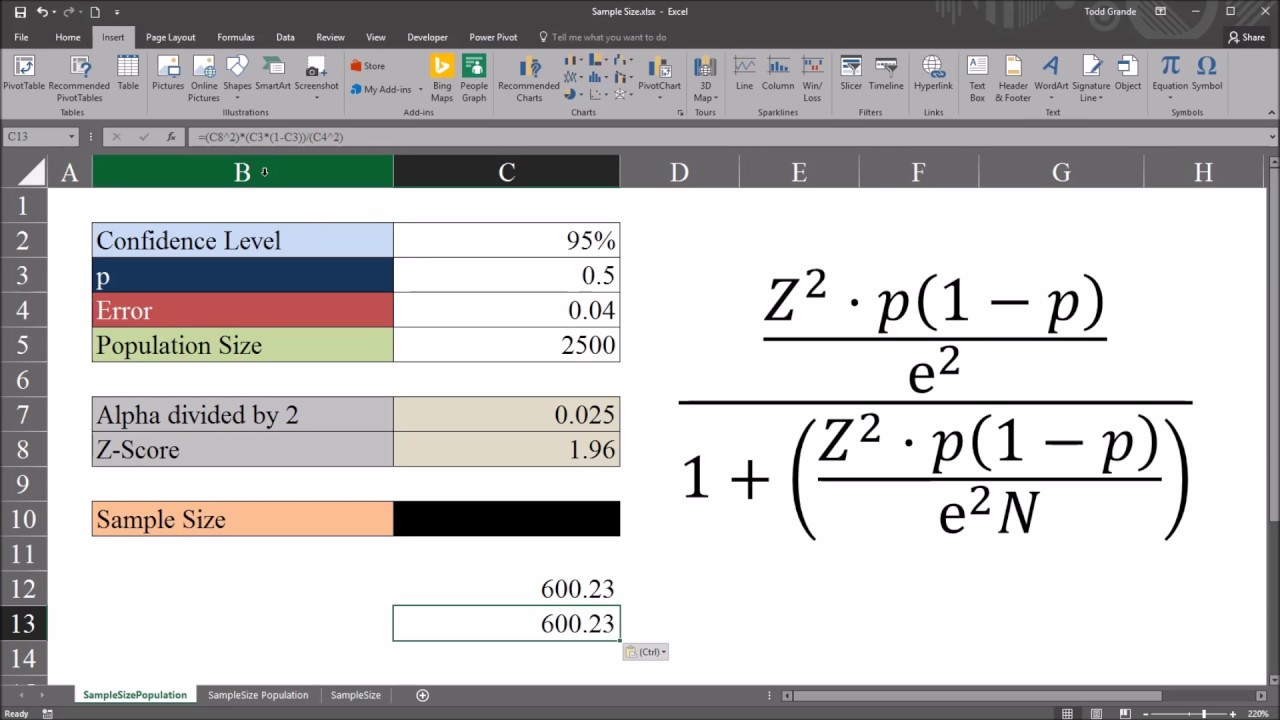 ▶
Calculating the Sample Size with a Finite Population in ExcelDr. Todd Grande · Nov 1, 2016
 ▶
One-Way ANOVA with LSD (Least Significant Difference) Post Hoc Test in ExcelDr. Todd Grande · Oct 1, 2016
 ▶
Stem and Leaf Plot (Stemplot) using COUNTIF and REPT Functions in ExcelDr. Todd Grande · Sep 25, 2016
 ▶
Interquartile Range (IQR), Outlier Detection, and Boxplots in ExcelDr. Todd Grande · Sep 24, 2016
 ▶
Calculating Cronbach's Alpha in Microsoft Excel Compared to SPSSDr. Todd Grande · Sep 19, 2016
 ▶
Graphing a Rolling (Moving) Average Dynamically using Microsoft ExcelDr. Todd Grande · Sep 13, 2016
 ▶
Array Formulas for Complex Calculations in Microsoft ExcelDr. Todd Grande · Sep 7, 2016
 ▶
Median Absolute Deviation using Microsoft ExcelDr. Todd Grande · Sep 5, 2016
 ▶
Mean Deviation Compared to Standard Deviation in ExcelDr. Todd Grande · Sep 3, 2016
 ▶
Managing Histogram Bins in Microsoft Excel Including Bin Width and NumberDr. Todd Grande · Aug 30, 2016
 ▶
Creating Waterfall Charts in Microsoft Excel 2016Dr. Todd Grande · Aug 29, 2016
 ▶
Predict Outcome Value with SLOPE and INTERCEPT Functions in ExcelDr. Todd Grande · Aug 25, 2016
 ▶
Conducting a Multiple Regression using Microsoft Excel Data Analysis ToolsDr. Todd Grande · Aug 23, 2016
 ▶
Calculating the 95% Confidence Interval after a T Test using ExcelDr. Todd Grande · Aug 10, 2016
 ▶
One-Sample T Test using ExcelDr. Todd Grande · Aug 7, 2016
 ▶
Independent Samples T-Test from Only Sample Size, Mean, and Standard Deviation in ExcelDr. Todd Grande · Aug 6, 2016
 ▶
Calculating Type II Error (Beta) and Power using ExcelDr. Todd Grande · Jul 18, 2016
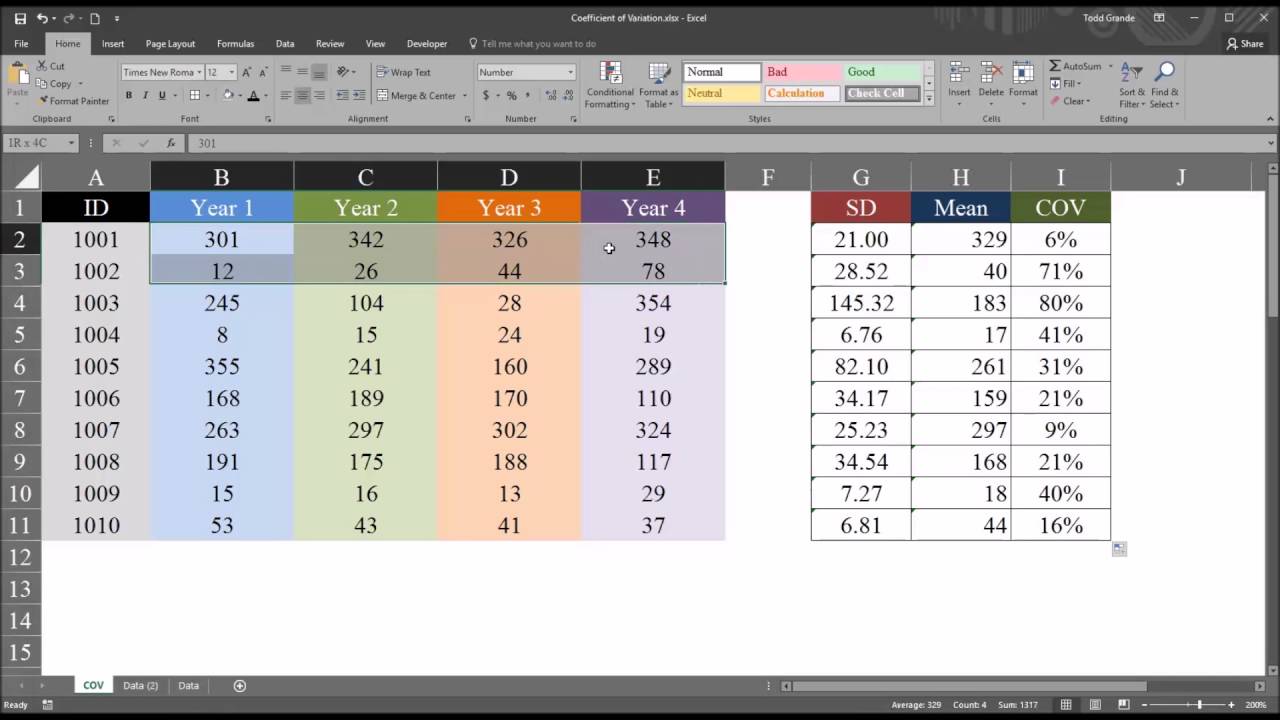 ▶
Calculating and Understanding the Coefficient of Variation COV in ExcelDr. Todd Grande · May 6, 2016
 ▶
Creating and Interpreting Scatterplot (Scatter Chart) in Excel 2016Dr. Todd Grande · Apr 28, 2016
 ▶
Calculating and Understanding Covariance (COVARIANCE.S) in ExcelDr. Todd Grande · Apr 24, 2016
 ▶
Drawing Random Samples with the Sampling Function in Excel 2016Dr. Todd Grande · Apr 22, 2016
 ▶
Random Number Generation Function in Excel 2016 to Produce Multiple DistributionsDr. Todd Grande · Apr 21, 2016
 ▶
Two-Way ANOVA without Replication using Excel Data Analysis ToolsDr. Todd Grande · Apr 17, 2016
 ▶
Two-Way ANOVA with Replication using Excel 2016 Data Analysis ToolsDr. Todd Grande · Apr 17, 2016
 ▶
One-Way ANOVA (ANOVA: Single Factor) using Excel 2016 Data Analysis ToolsDr. Todd Grande · Apr 17, 2016
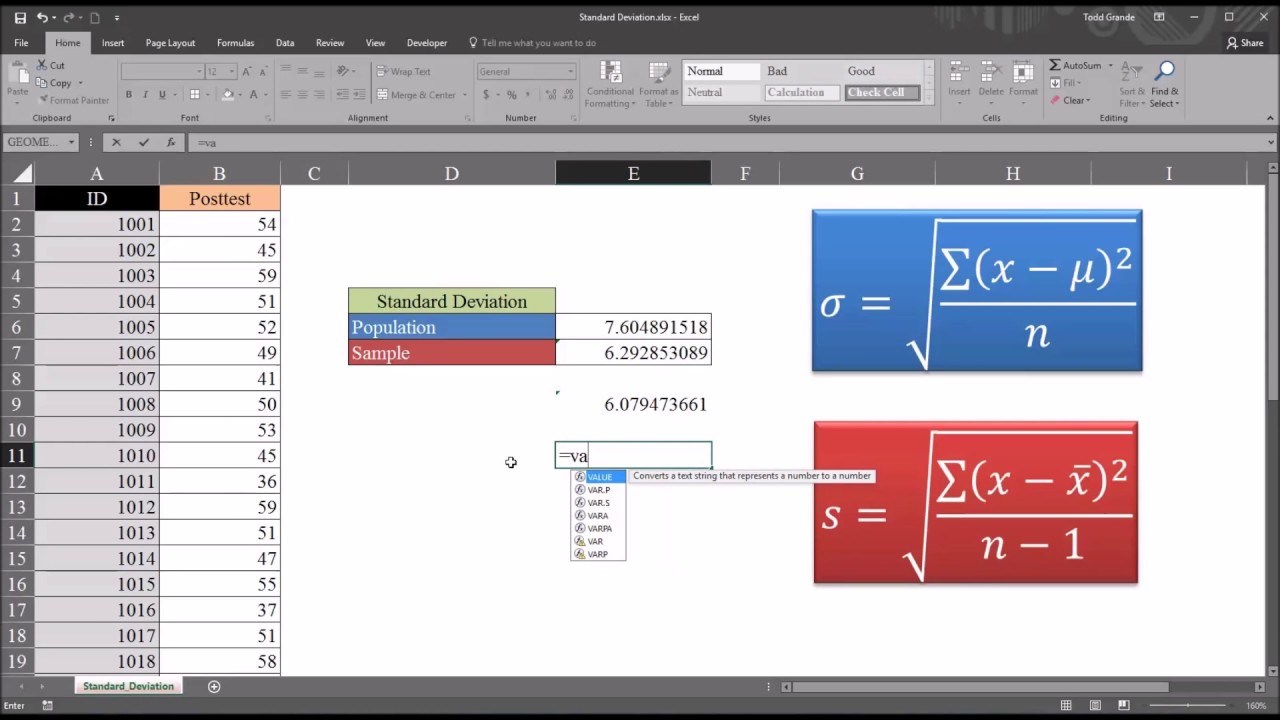 ▶
Understanding Sample (STDEV.S) and Population (STDEV.P) Standard Deviation using ExcelDr. Todd Grande · Apr 14, 2016
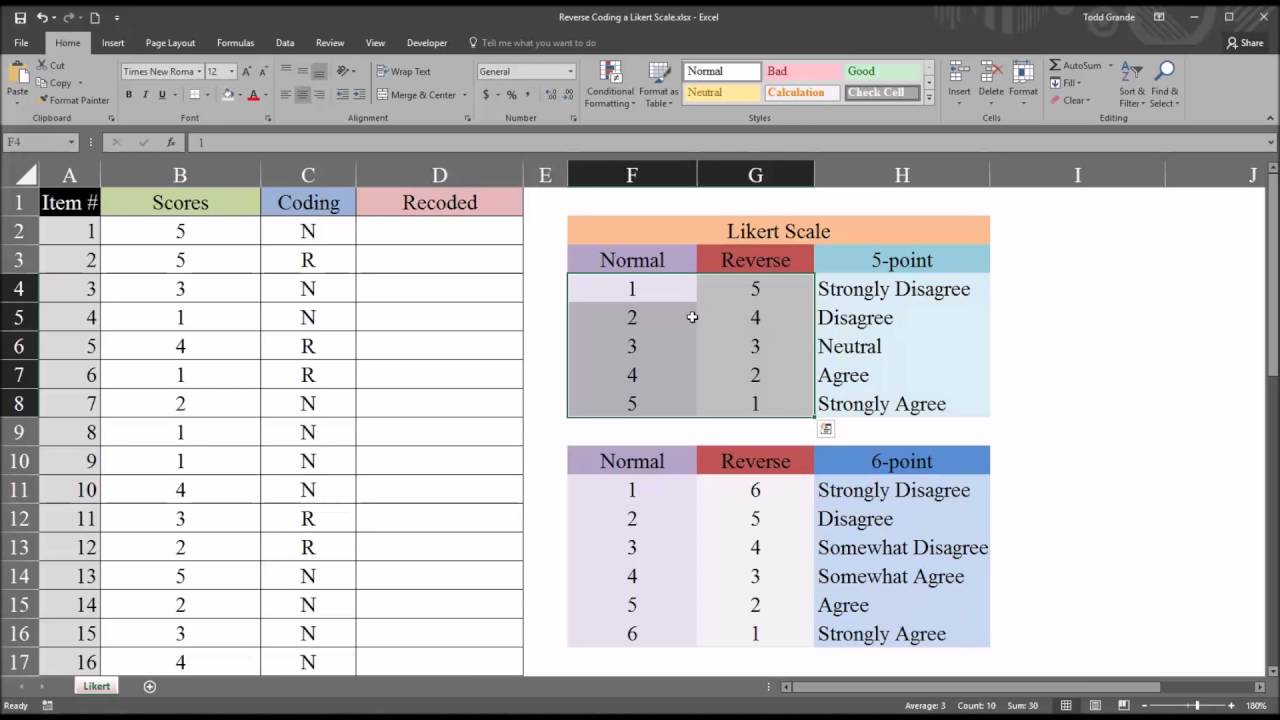 ▶
Reverse Coding a Likert Scale in ExcelDr. Todd Grande · Apr 11, 2016
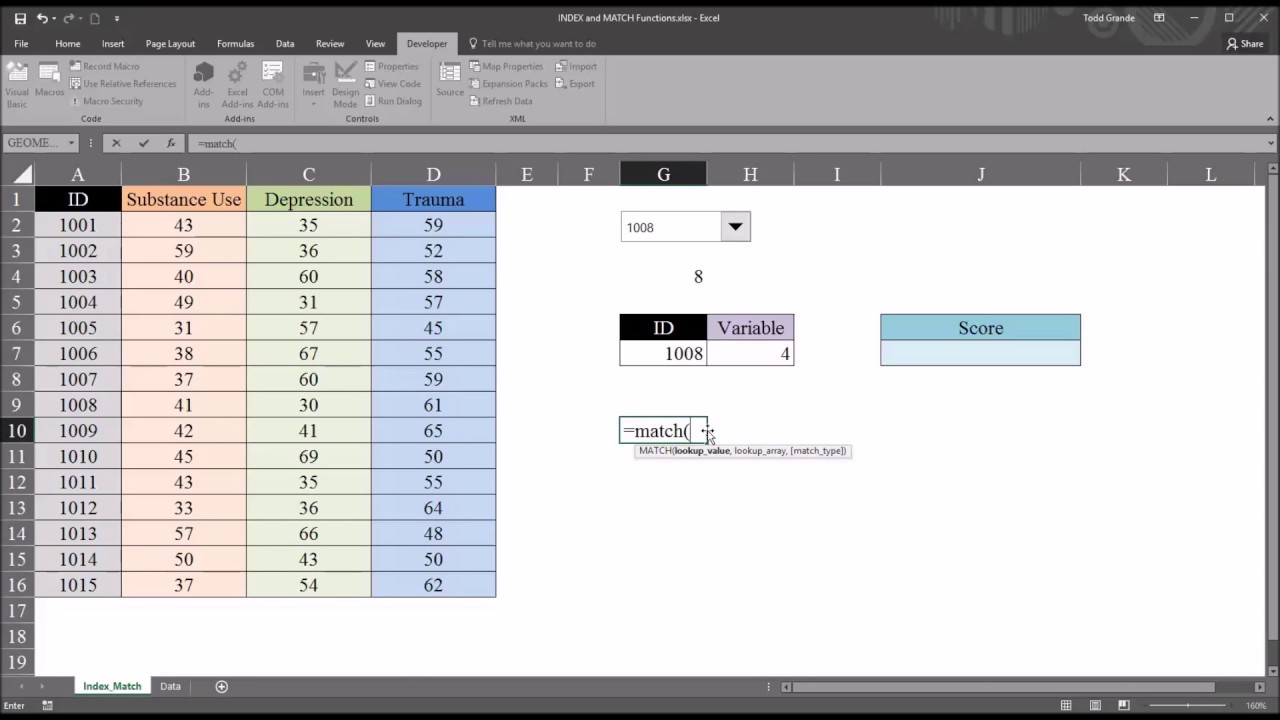 ▶
INDEX and MATCH Functions in Excel to Return Value in Different Column than Search ValueDr. Todd Grande · Apr 9, 2016
 ▶
Calculating Critical Values for T Distribution in Excel and Building ChartDr. Todd Grande · Apr 3, 2016
 ▶
Manually Calculate Paired-Samples (Dependent-Samples) T Test in ExcelDr. Todd Grande · Apr 2, 2016
 ▶
Manually Calculate Independent-Samples T Test in ExcelDr. Todd Grande · Apr 2, 2016
 ▶
Using the Ink Equation Feature in Excel to Write EquationsDr. Todd Grande · Mar 31, 2016
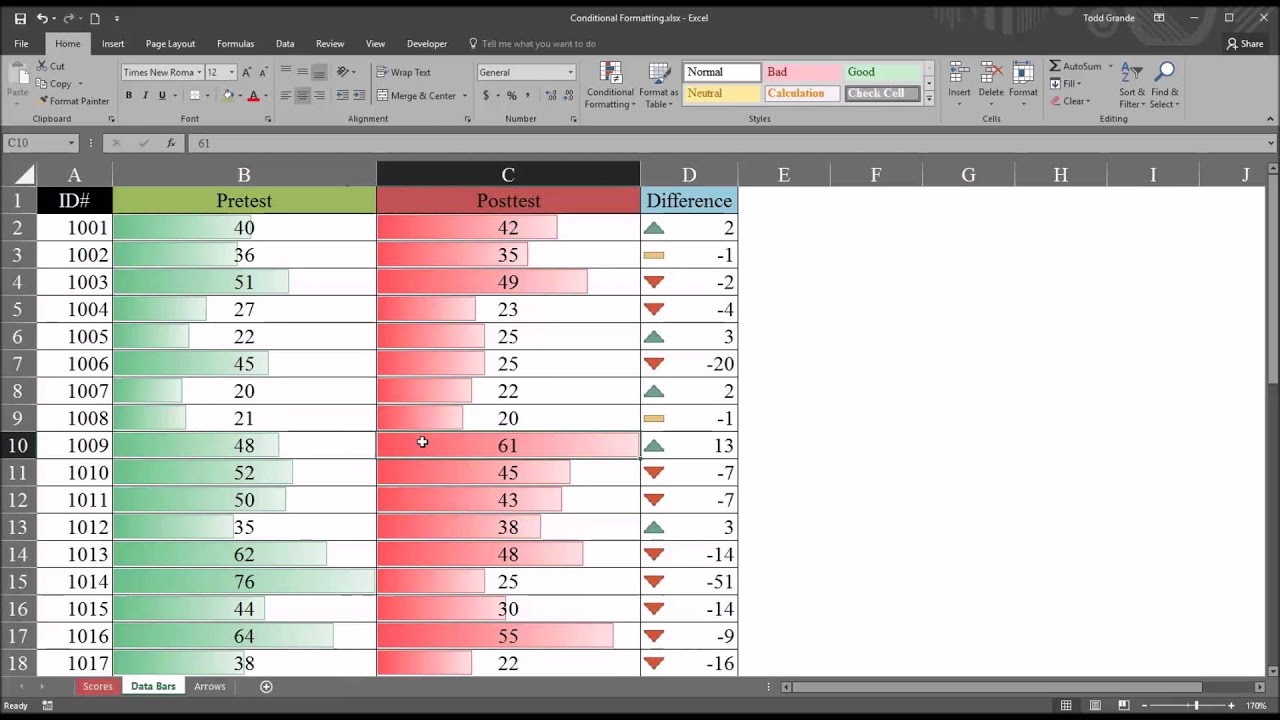 ▶
Using Data Bars to Compare Pretest and Posttest Variables in ExcelDr. Todd Grande · Mar 29, 2016
 ▶
Using the REPT Function in Excel to Display Data GraphicallyDr. Todd Grande · Mar 29, 2016
 ▶
Excel Data Validation to Facilitate Correct Entry of Research DataDr. Todd Grande · Mar 20, 2016
 ▶
Conditional Formatting with Icon Sets to Indicate Score Differences in ExcelDr. Todd Grande · Mar 19, 2016
 ▶
Formatting and Counting Dates Occurring Before or After a Specified DateDr. Todd Grande · Feb 29, 2016
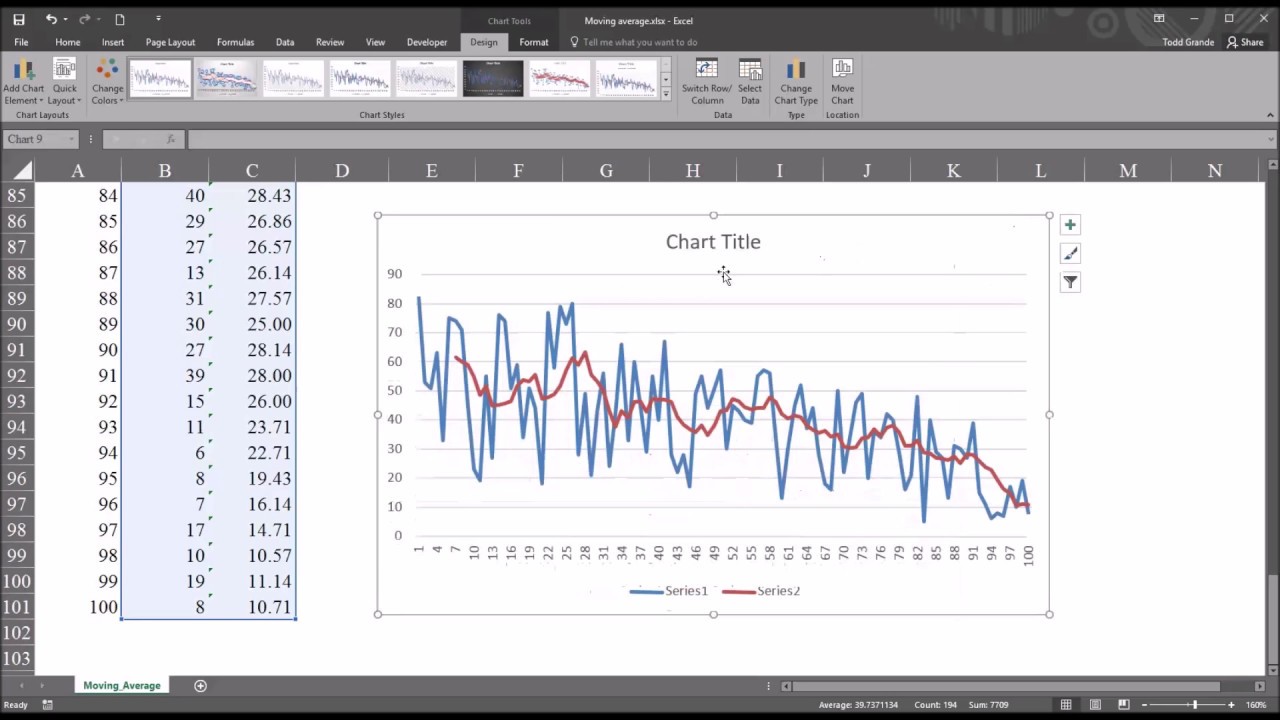 ▶
Moving (Rolling) Average in Excel 2016Dr. Todd Grande · Feb 11, 2016
 ▶
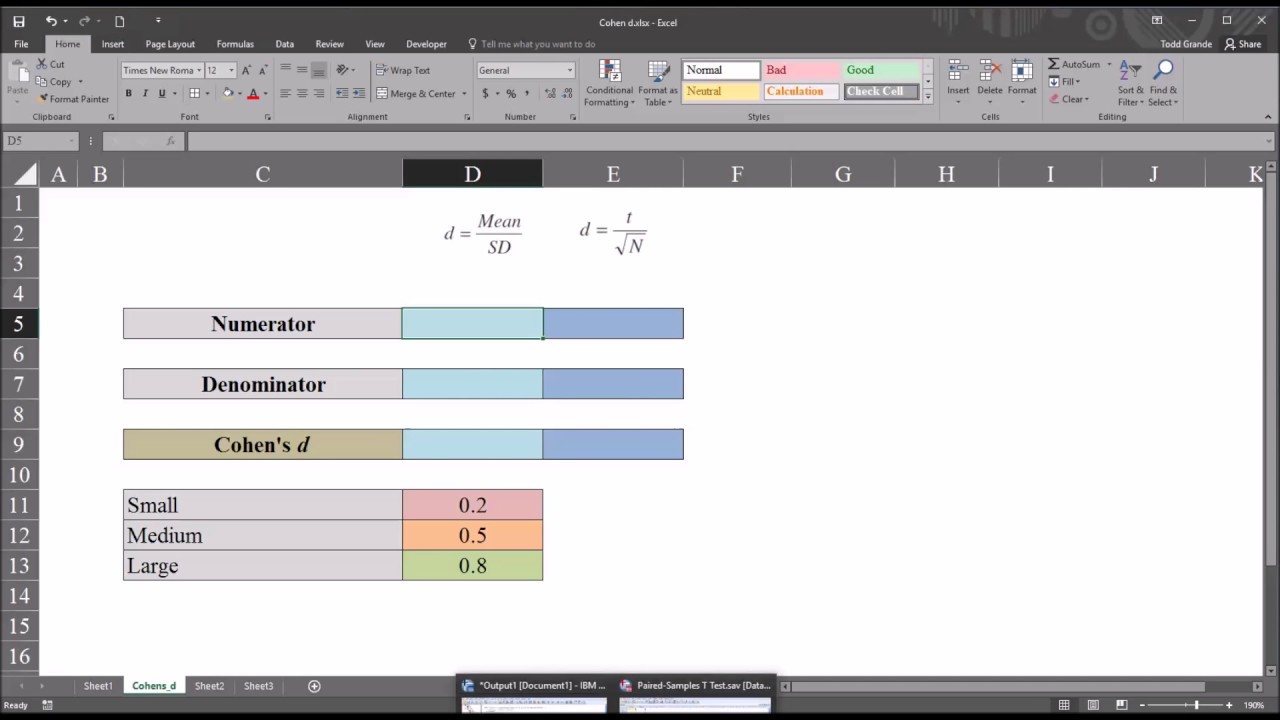
Calculating Effect Size (Cohen's d) for a One-Sample T TestDr. Todd Grande · Feb 8, 2016
 ▶
Calculating Effect Size (Cohen's d) for a Paired-Samples T TestDr. Todd Grande · Feb 7, 2016
 ▶
Calculating Percentage Change in ExcelDr. Todd Grande · Feb 5, 2016
 ▶
Calculating and Interpreting the Standard Error of the Estimate (SEE) in ExcelDr. Todd Grande · Jan 2, 2016
 ▶
Calculating and Interpreting the Standard Error of Measurement using ExcelDr. Todd Grande · Jan 1, 2016
 ▶
Formula Auditing including Trace Precedents and Trace Dependents in ExcelDr. Todd Grande · Dec 24, 2015
 ▶
95% Confidence Interval in Excel using CONFIDENCE.NORM and Standard Error of the MeanDr. Todd Grande · Dec 23, 2015
 ▶
Jarque-Bera Test of Normality in ExcelDr. Todd Grande · Dec 21, 2015
 ▶
Reflection of a Negatively Skewed Variable using ExcelDr. Todd Grande · Dec 13, 2015
 ▶
Levene's Test of Homogeneity of Variance using Only Excel Functions Compared to SPSSDr. Todd Grande · Dec 7, 2015
 ▶
ANOVA Step-by-Step in Excel with Interpretation of Results and Comparison to SPSS OutputDr. Todd Grande · Dec 5, 2015
 ▶
Calculating Mahalanobis Distance Critical Values in ExcelDr. Todd Grande · Nov 29, 2015
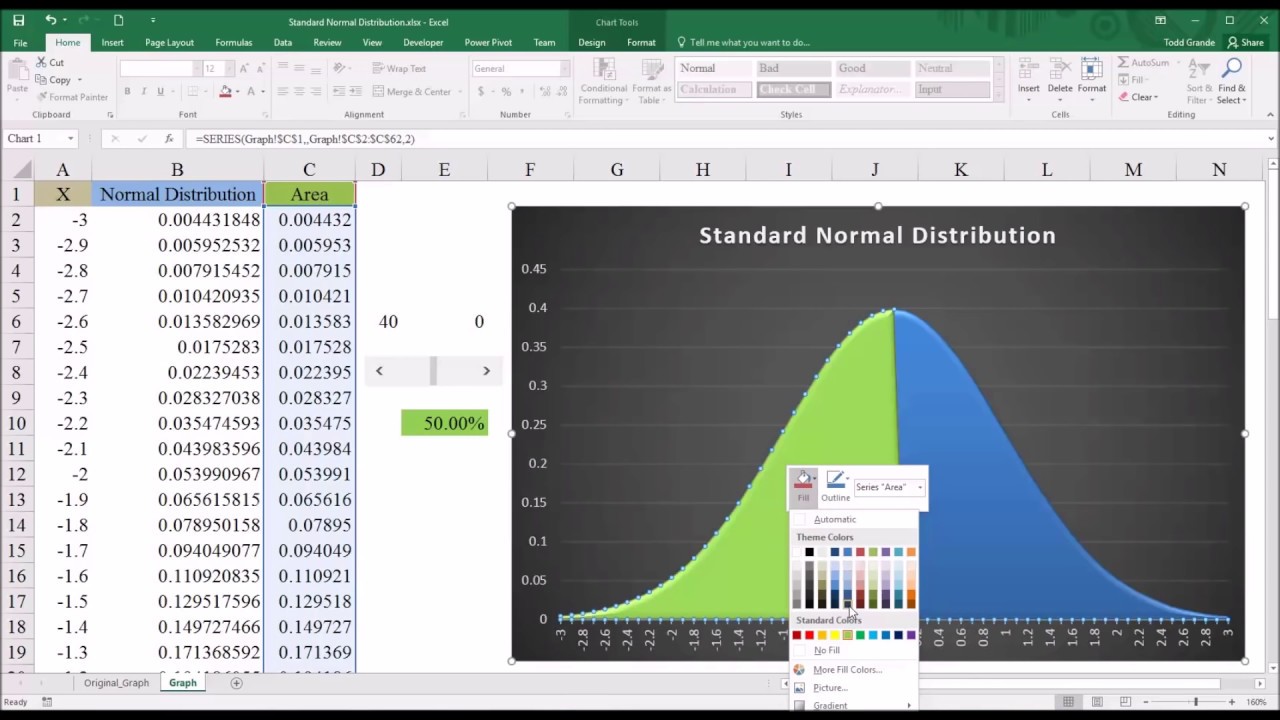 ▶
Creating a Graph of the Standard Normal Distribution in ExcelDr. Todd Grande · Nov 27, 2015
 ▶
Normality Testing in Excel Compared with SPSS OutputDr. Todd Grande · Nov 26, 2015
 ▶
FORECAST.ETS Function (Exponential Triple Smoothing) in ExcelDr. Todd Grande · Oct 26, 2015
 ▶
Conducting a Square Root Transformation in ExcelDr. Todd Grande · Oct 19, 2015
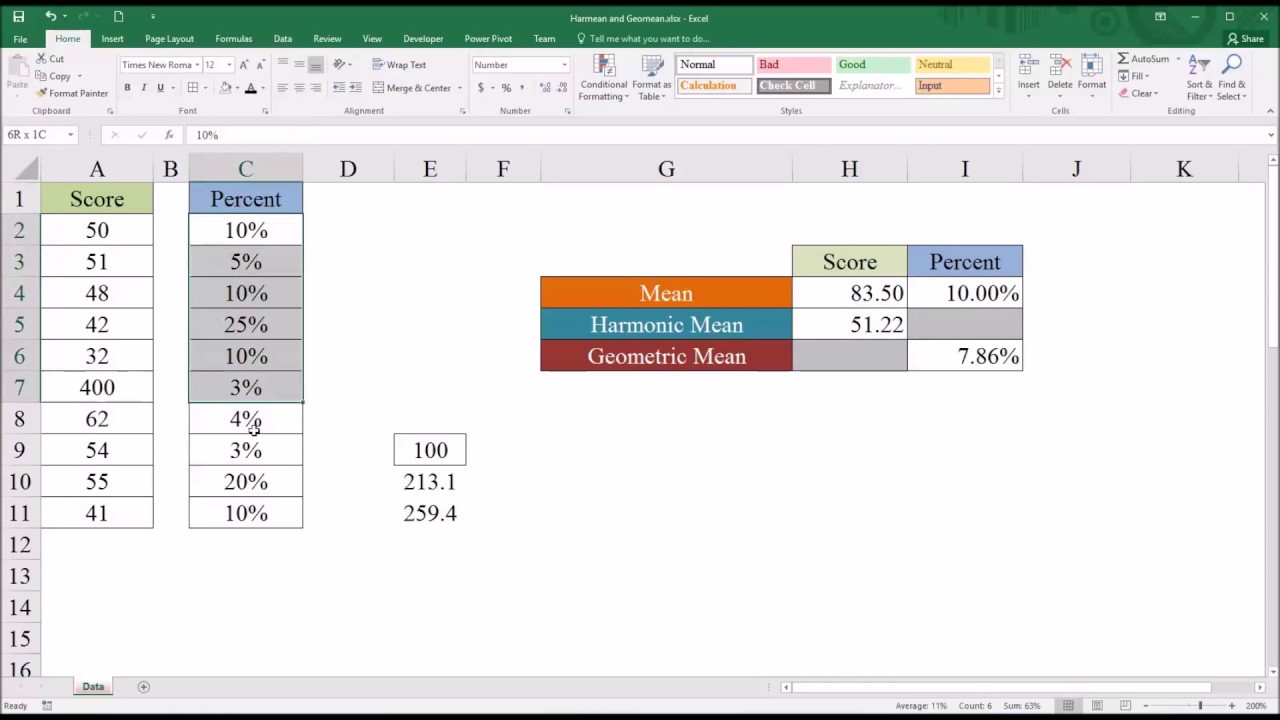 ▶
Arithmetic, Harmonic, and Geometric Means in ExcelDr. Todd Grande · Oct 15, 2015
 ▶
Creating a Histogram in Microsoft Excel 2016Dr. Todd Grande · Oct 14, 2015
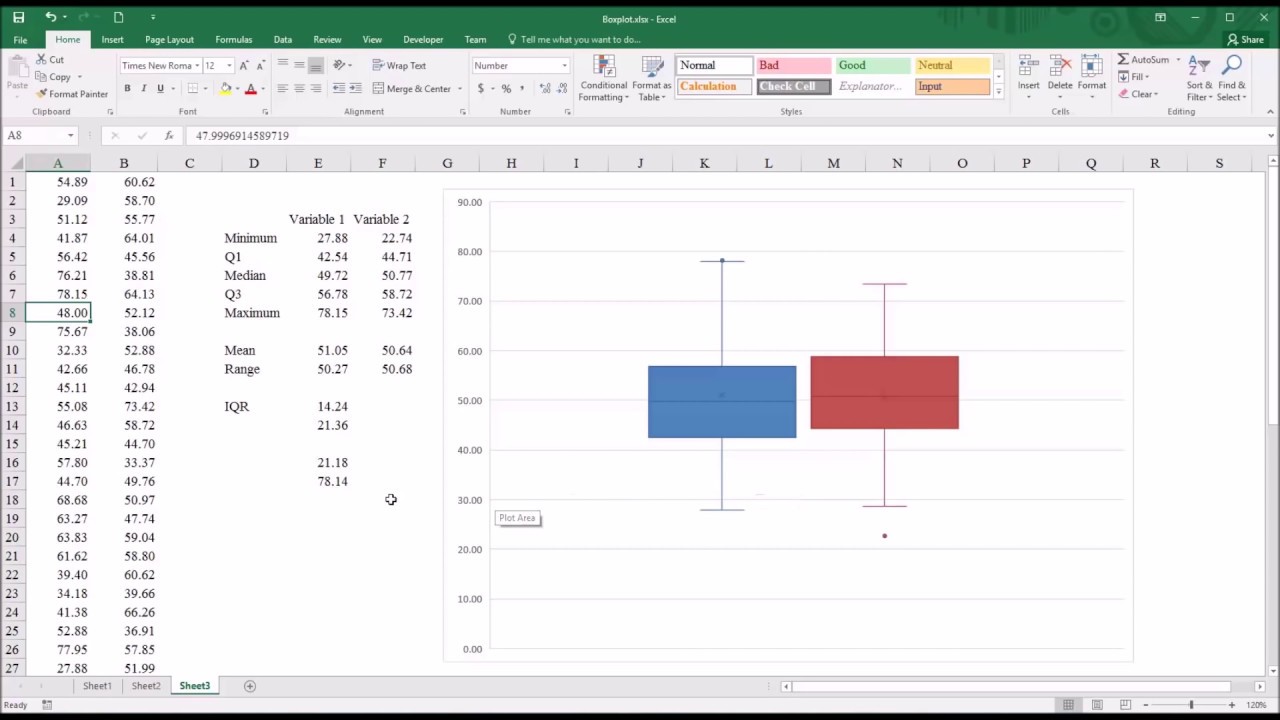 ▶
Creating a Boxplot in Excel 2016Dr. Todd Grande · Oct 14, 2015
 ▶
Creating a Boxplot in ExcelDr. Todd Grande · Sep 26, 2015
 ▶
Creating Random Numbers that Follow a Poisson Distribution Using ExcelDr. Todd Grande · Sep 22, 2015
 ▶
Creating Random Numbers that Follow a Discrete Distribution Using ExcelDr. Todd Grande · Sep 17, 2015
 ▶
Creating Random Numbers that Follow a Normal Distribution Using ExcelDr. Todd Grande · Sep 16, 2015
 ▶
Spearman's Rank Correlation Coefficient in ExcelDr. Todd Grande · Aug 17, 2015
 ▶
Weighted and Unweighted Averages in ExcelDr. Todd Grande · Aug 4, 2015
 ▶
Adding Ordinal Notation to Integers in ExcelDr. Todd Grande · Aug 2, 2015
 ▶
The NORM.DIST and Related Functions in ExcelDr. Todd Grande · Jul 20, 2015
 ▶
Identifying and Highlighting Outliers in ExcelDr. Todd Grande · Jul 19, 2015